
One of the things all engineers should know how to do is to express risk in terms that can be measured. Here’s how to do that.
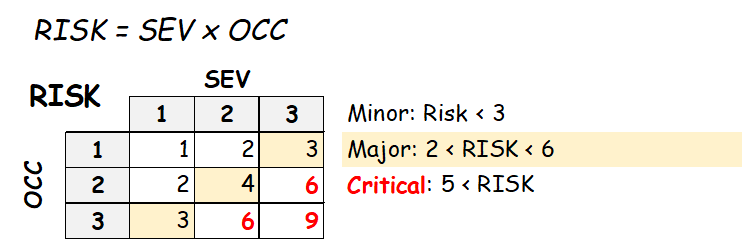
RISK = Severity x Occurrence
The common understanding of numerical risk assessment considers severity and occurrence by weighting them (multiplying) against each other. This was established by the military decades ago and has become the standard for all industry; Aerospace, Medical, Pharmaceutical, Automotive, etc. This article uses a scale of 1 to 3 for reasons that will be covered at the end of the article.
Estimate Severity
If the thing you are considering goes completely south, how bad will the failure be? For a completed project the failure would be estimated in terms of the consumer’s perspective – a low severity would be something that the end user might notice but wouldn’t be something they would complain about (or return). A high severity would be if the product didn’t work or was soo poorly made or designed that it caused damage or injury. A medium severity would be anything in between. For a manufactured part that is going into s subassembly, treat this as if you were the customer. If the part has some scratches or very minor issues, that would be a low severity. If the part needed to be replaced or reworked in a significant way, the severity is high. Anything in between is medium.
Give Severity a number. 1 is low, 3 is high, 2 is medium.
Estimate Occurrence
Take the same approach to occurrence, or the likelihood of the failure happening. If you expect the failure to happen rarely – if ever – then the likelihood is low. If the chances of the failure are inevitable or consistently high then the occurrence is high. Anything in between is medium. For the purists, this is not a question of “will this failure ever happen, ever?” the answer is obviously “yes” since the world is imperfect. That does not mean all questions of occurrence are always high – the question to consider is “will every instance, or every assembly or every part or every use stand a high chance of failure”.
Give Occurrence a number. 1 is low, 3 is high, 2 is medium.
Before going further it it important to try and involve more than one person in the estimate of risk. These two numbers – severity and occurrence – should include three or more opinions, since they are often just opinions. The opinion can only be as reliable as the subject matter expertise, so getting more than one opinion is important. There will always be conditions where you will not have others to use as contributors or litmus – that’s okay. Just don’t make a habit out of it.
Determine RISK
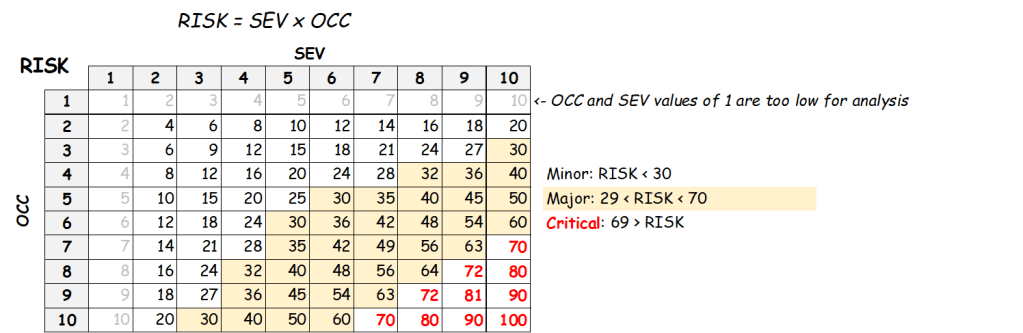
Risk is commonly referred to in one of three levels – Minor, Major, and Critical. Minor risk typically does not affect the capability of the part or system to achieve the intended results – this means things like cosmetic defects happening at almost any frequency, or more significant imperfections happening vary rarely. Major risk refers to affecting the output such that it cannot achieve the intended result. Critical is an extension of Major such that the risk may impact more than just the subject under consideration, or may impact the subject under consideration to the extent that it becomes a threat to the company. To convert the Severity and Occurrence to Risk just multiply the two together and then refer to this table:
That’s it. This fast and simple analysis gives you a clear understanding of the risk for just about anything. Here are a few examples:
Riding a skateboard down a high hill for the first time. Severity is 3 ’cause that will really hurt, Occurrence is 3, especially if you ask your dad. Risk is critical – go find a smaller hill
Machining a part with block tolerances. Severity is 2 because you will likely be able to rework the part and the tolerances are not difficult, Occurrence is 1 because the block tolerances are based on machine capability. Risk is minor, proceed.
Reheating whatever is in that plastic container for lunch. Severity is 2 because it probably won’t kill you, Occurrence is 2 because you’ve had some past experience and you aren’t really sure how long it has been in there. Risk is Major, tread carefully.
Sending an email to a customer telling them their project will be very late. Severity is 3 because you know the customer has a history of cancelling jobs. Occurrence is 3 for the exact same reason. Risk is critical, this is an email that should be sent by someone very senior in the company, and that’s not you.
Using a new DC motor in a medical device pump. Severity is 3 because this pump is used to feed intubated patients. Occurrence is unknown because this is a pump without a lot of history, so the team puts the occurrence at 2. Risk is Critical, it is a good idea to get a statistical sample of these motors and determine their actual stable life to improve occurrence before proceeding.
Nuts and Bolts
Because of the simplicity of this technique there are many folks who raise an eyebrow. Doesn’t the industry have an established means for determining risk? Yes! Of course they do! And this approach is that very same method. Read on if you have a need or desire to understand how the two techniques correlate.
Standard Risk Assessment – 1-10 scale.
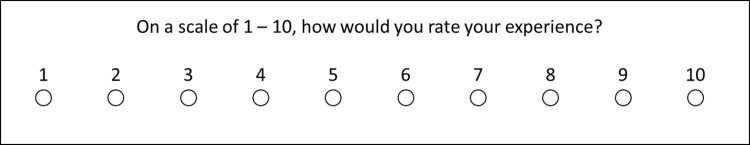
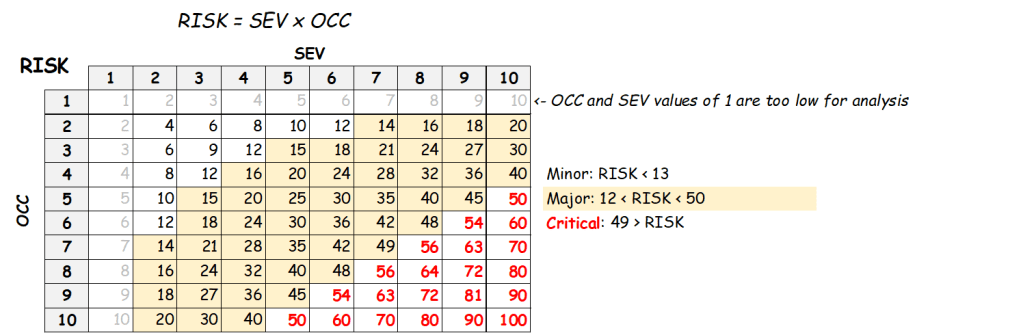
The tried and true risk assessment uses a scale of 1 to 10 for both severity and occurrence. This level of granularity has been used to give engineers and risk analysts comfort in being able to fine-tune their degree of concern. There is nothing wrong with this but it introduces barriers to efficiency and consistency. Efficiency is impacted because the granularity of the scale creates debate and conflict when the value of the debate is negligible. Consider two points – first, the scale of 1 to 10 is designed to filter down to a rank of 1 to 3. There are no risk scales with 10 levels. This means a team can discuss if a severity is a 5 or a 6 when the occurrence is 8 and the debate will ultimately have no effect on the end result. Next consider the number 1. On a matrix scale of 1 to 10 the columns where either value – Severity or Occurrence – are given a value of 1 the result is par, the other end of the matrix remains unchanged. For that reason the rank of 1 for either Severity or Occurrence indicates the question of risk may not have value.
Scale difference – 1-10 vs 1-3
The next question is around the scale difference. The thresholds shown on the 10/10 chart are at risk values of 13 and 50 – that results in the mid-range band shown. Why aren’t the values set at 30 and 70? Or 20 and 80? Those seem logical. The reason is because we are not assessing the value, we are considering the frequency of population. First, observe that if a threshold of 30 and 70 was introduced the results would show that more than 50% of all cases become Minor. It means that a case where the severity is 10 (death, in the case of the medical device world) and an occurrence of 3 (occasional) means no consideration of safety is needed. That defies logic. If death is the question, some study must be expected. On the other end of that scale the only things that would be considered critical is when it happens more often than 80% of the time and death must also be on the line. Also a logic challenging response.
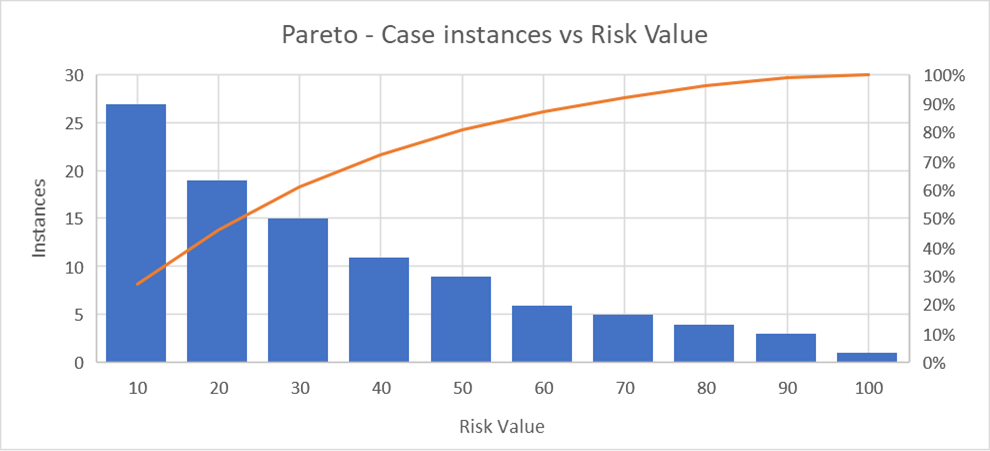
The thresholds of 13 and 50 are determined using a Pareto analysis. The goal is to have the top 20% of cases, the rare conditions, fall into a critical category – these MUST be considered. The bottom 30% of cases, the low severity and rare instance cases, fall into the minor category. The remainder are Major and should be considered and examined before proceeding.
Good risk analysis is a necessary tool for any engineer. Knowing how to do a risk analysis quickly and with confidence that the results are guiding you in the right direction will benefit you, your boss, your company and most of all – your customers. You can use the high granularity scale, but more often than not the value isn’t there. Sometimes its best not to overthink a thing.
